一、简介
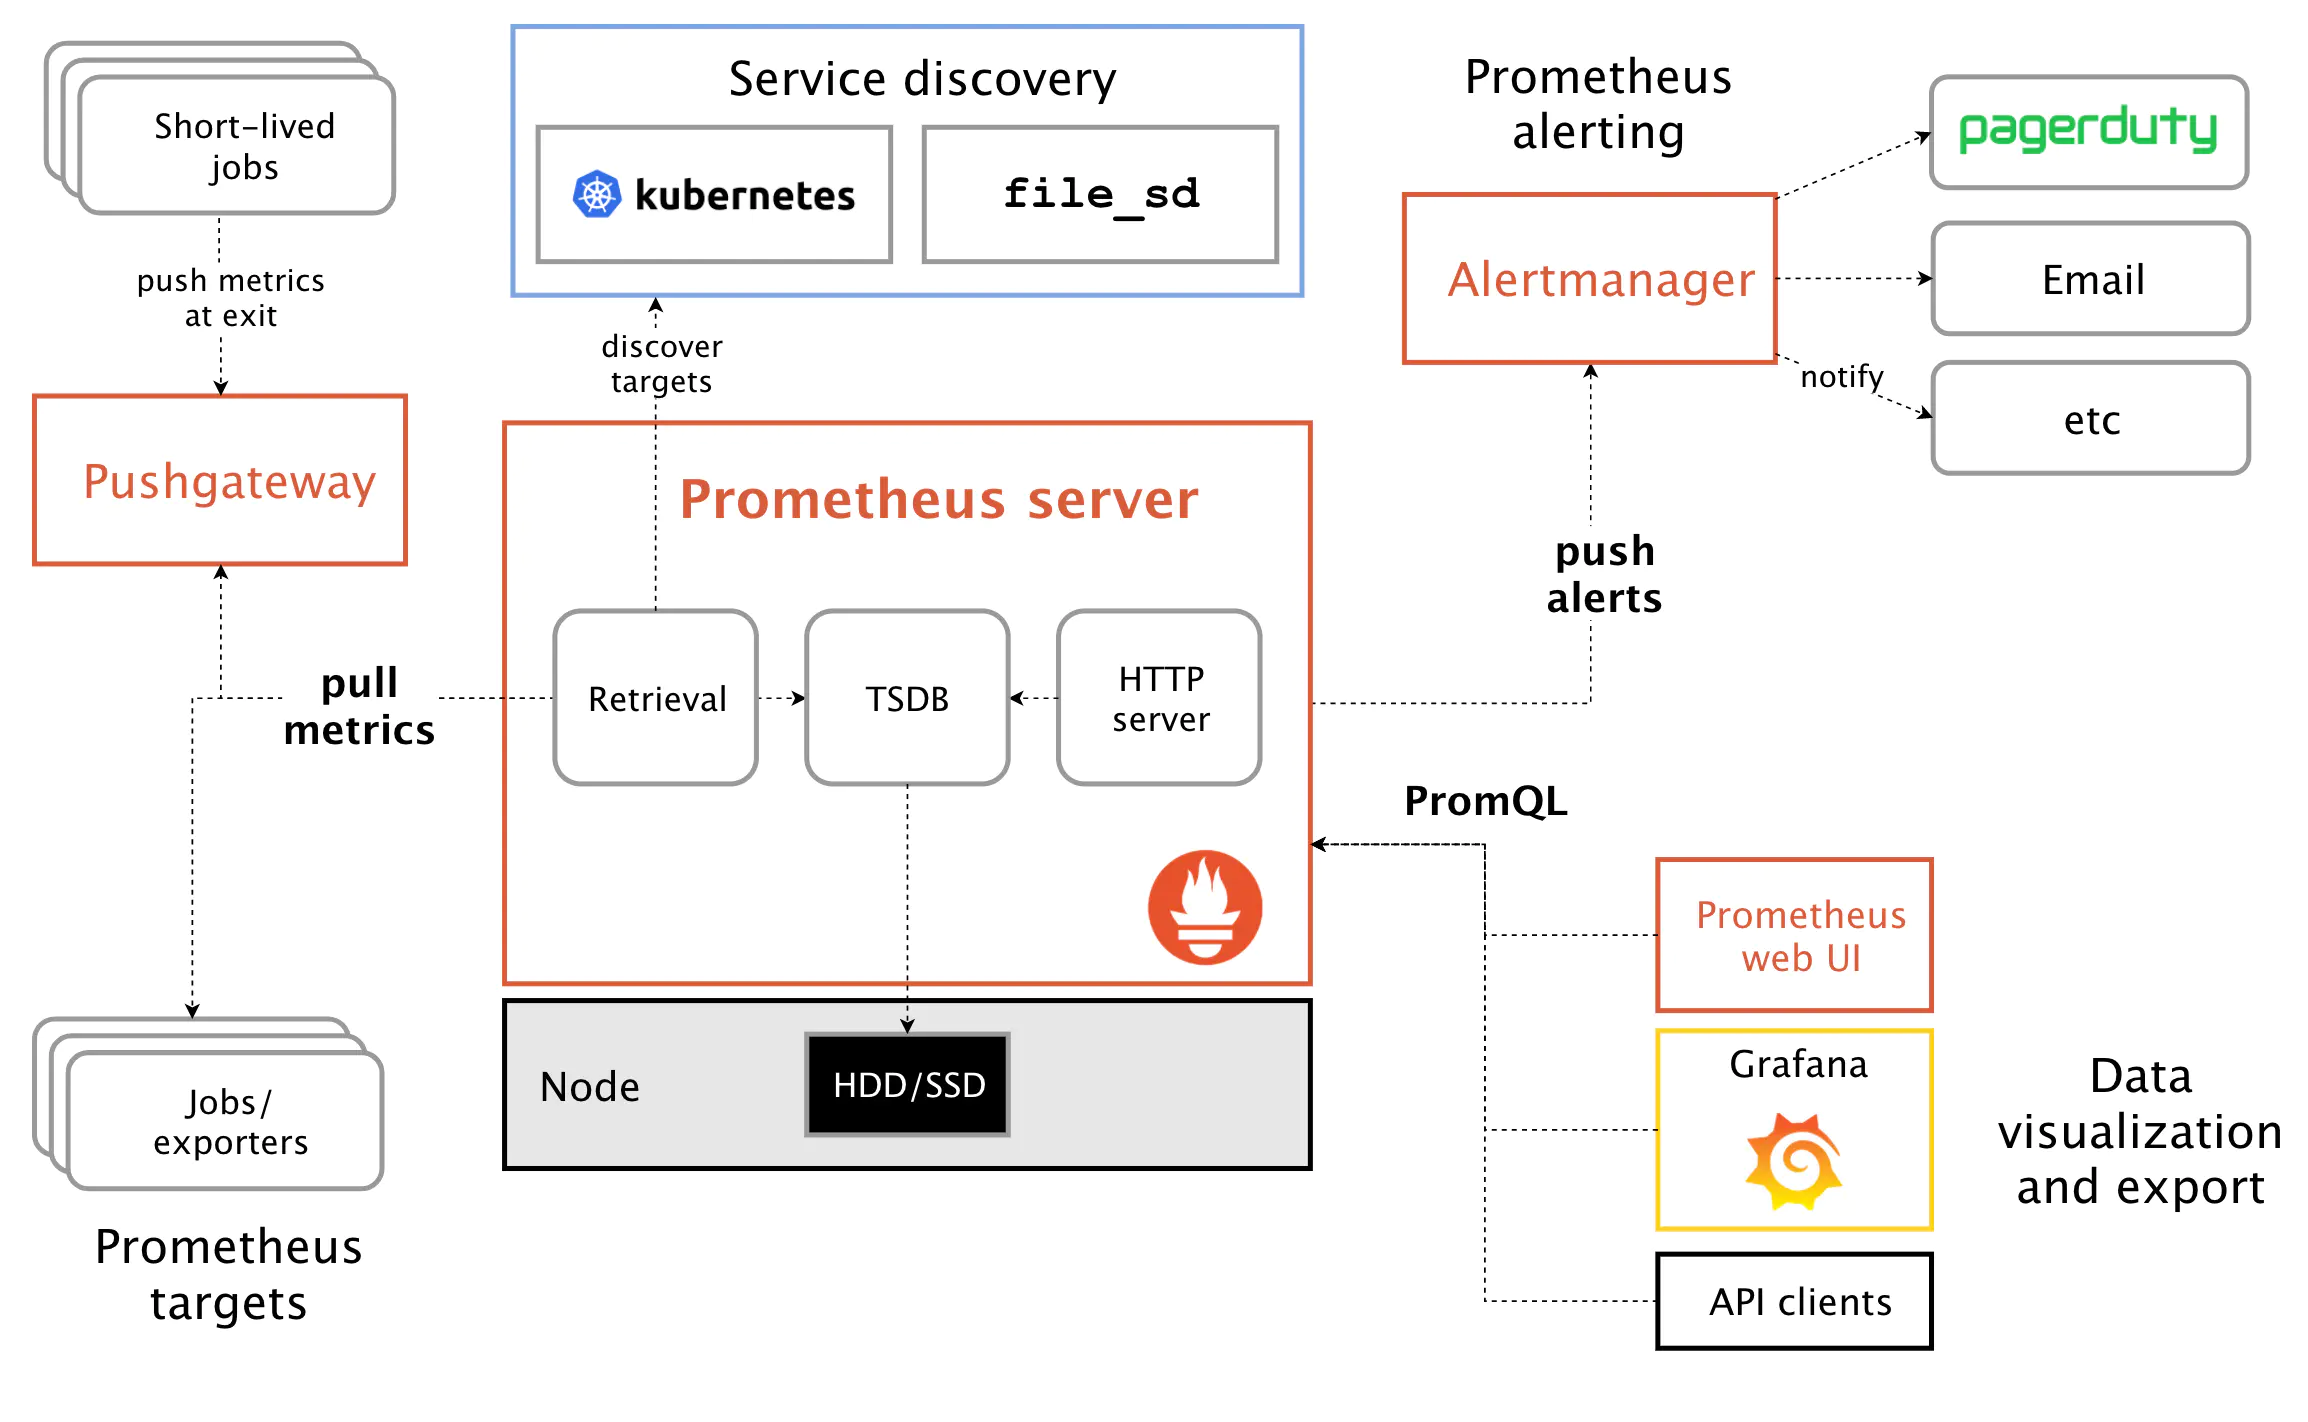
Prometheus 是由 SoundCloud 开源监控告警解决方案,包含了Pushgateway、Prometheus Server、Jobs/exporters、Alertmanager、Prometheus web UI等组件,各个组件可以另外搭配使用。
Prometheus Server :Prometheus的核心模块,负责数据的抓取、存储和查询功能,同时它也是一款时序数据库。
Jobs/exporters:用于采集数据,并通过 HTTP 服务的形式暴露给 Prometheus Server,按不同的业务进行独立划分,比如服务器监控(node_exporter)、MySQL监控(mysqld_exporter)等等提供了若干主流软件对应的exporter,当然也可以自定义exporter,Prometheus Server通过pull模式去抓取各个exporters的数据。
Pushgateway:作为push模式的中转站,也就是如果我们的jobs是push模式推送数据,那么将于Prometheus Server工作模式不兼容,这是需要在jobs和Prometheus Server中间搭建Pushgateway,jobs把数据push到Pushgateway,Prometheus Server再从Pushgateway中pull数据。
Alertmanager:告警模块,当Prometheus Server触发告警阈值时,通过push方式推送告警信息到Alertmanager,Alertmanager执行告警动作。
Prometheus web UI:WEB管理界面。
Prometheus具有强大的包容特点,比如展示界面可以用Grafana来替换,exporter支持自定义。而且具有强大的灵活性,比如不同监控对象通过xx_exporter来划分,下面我们搭建一个简易版本的监控平台:Prometheus Server + node_exporter + Grafana。
二、搭建
1、Prometheus Server
(1)下载安装包:https://github.com/prometheus/prometheus/releases/download/v2.31.1/prometheus-2.31.1.linux-amd64.tar.gz
(2)上传到Linux服务器上,通过下面命令启动
nohup ./prometheus --config.file=prometheus.yml > prometheus.log 2>&1 &
或者可以通过服务启动(强烈推荐!!!)
vim /usr/lib/systemd/system/prometheus.service
[Unit]
Description=https://prometheus.io

[Service]
Restart=on-failure
ExecStart=/root/prometheus/prometheus-2.31.1.linux-amd64/prometheus \
--config.file=/root/prometheus/prometheus-2.31.1.linux-amd64/prometheus.yml

[Install]
WantedBy=multi-user.target
保存之后,通过systemctl start prometheus 启动。
停止prometheus:systemctl stop prometheus
查看状态:systemctl status prometheus
注:Prometheus Server默认访问端口为9090.可以在浏览器上打开http://ip:9090查看
2、node_exporter
在Prometheus官网上支持多种exporter,这里只是已node_exporter作为例子。
(1)下载安装包:https://github.com/prometheus/node_exporter/releases/download/v1.3.1/node_exporter-1.3.1.linux-amd64.tar.gz
(2)上传到Linux服务器上,通过下面命令启动
nohup ./node_exporter --web.listen-address=":7049" > node.log 2>&1 &
注:通过上面的方式指定了该exporter暴露的访问端口为7049
(3)在Prometheus Server的prometheus.yml加上该exporter的配置信息,具体如下:
 - job_name: "服务器硬件监控"
    static_configs:
      - targets: ["localhost:7049"]
(4)添加完成后重启Prometheus Server
3、Grafana
(1)下载安装包:https://dl.grafana.com/enterprise/release/grafana-enterprise-9.2.4.linux-amd64.tar.gz
(2)上传到Linux服务器上,通过下面命令启动
nohup ./bin/grafana-server web > grafana.log 2>&1 &
注:grafana默认访问端口为3000.
(3)配置Prometheus数据源
访问http://192.168.253.101:3000/,默认账号、密码为admin 、 admin 。
可以在defaults.ini文件中修改端口号和账号密码等信息。
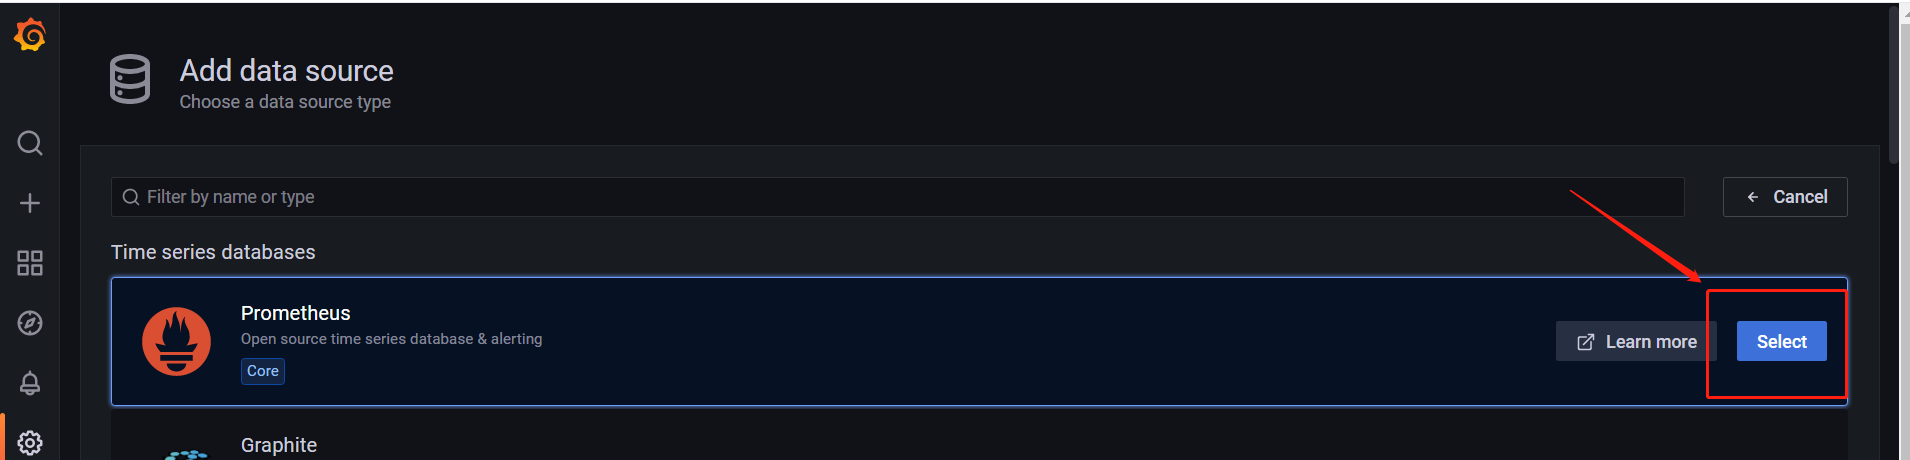
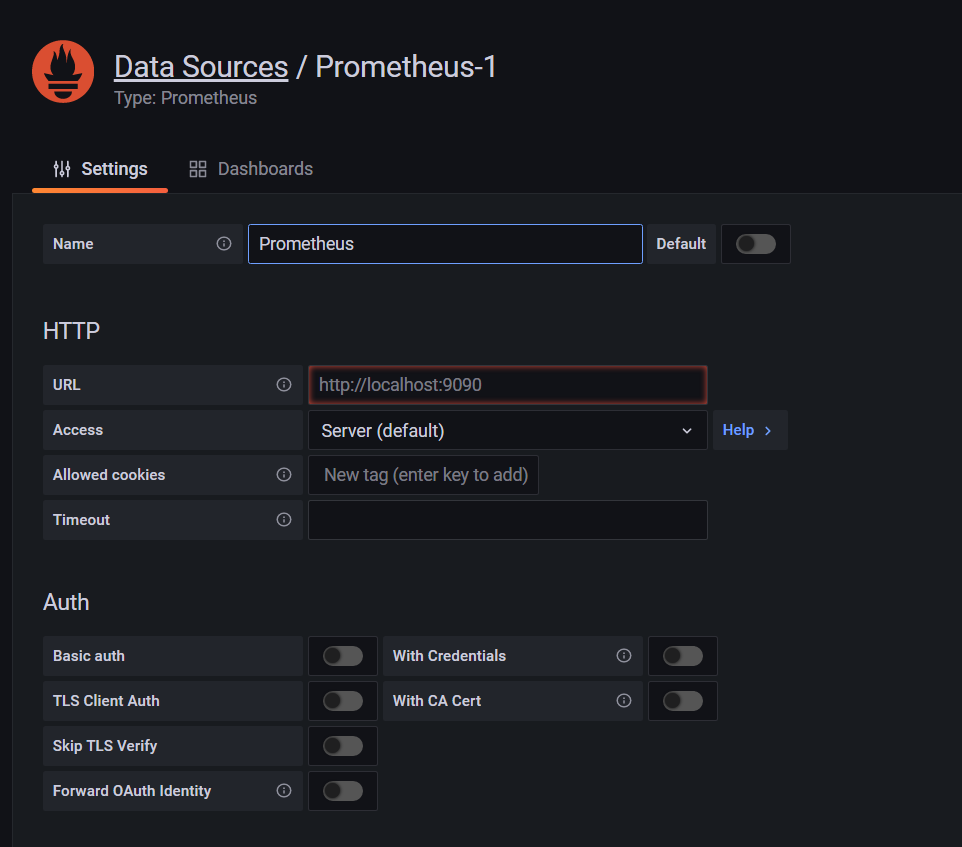
点击[Configuration]-> [Data Sources]进入到数据源配置页面,找到Prometheus,点击[Select]按钮即可进入到配置页面,在URL处输入Prometheus Server访问地址即可。
(4)选择Dashboard
Grafana之所以强大,其中一个特点就是灵活的Dashboard,可以根据不同的exporter选择不同Dashboard展示样式,一般情况下在官网上查询找到对应dashboard,然后导入即可,并不需要自己开发。
下载地址:https://grafana.com/grafana/dashboards/
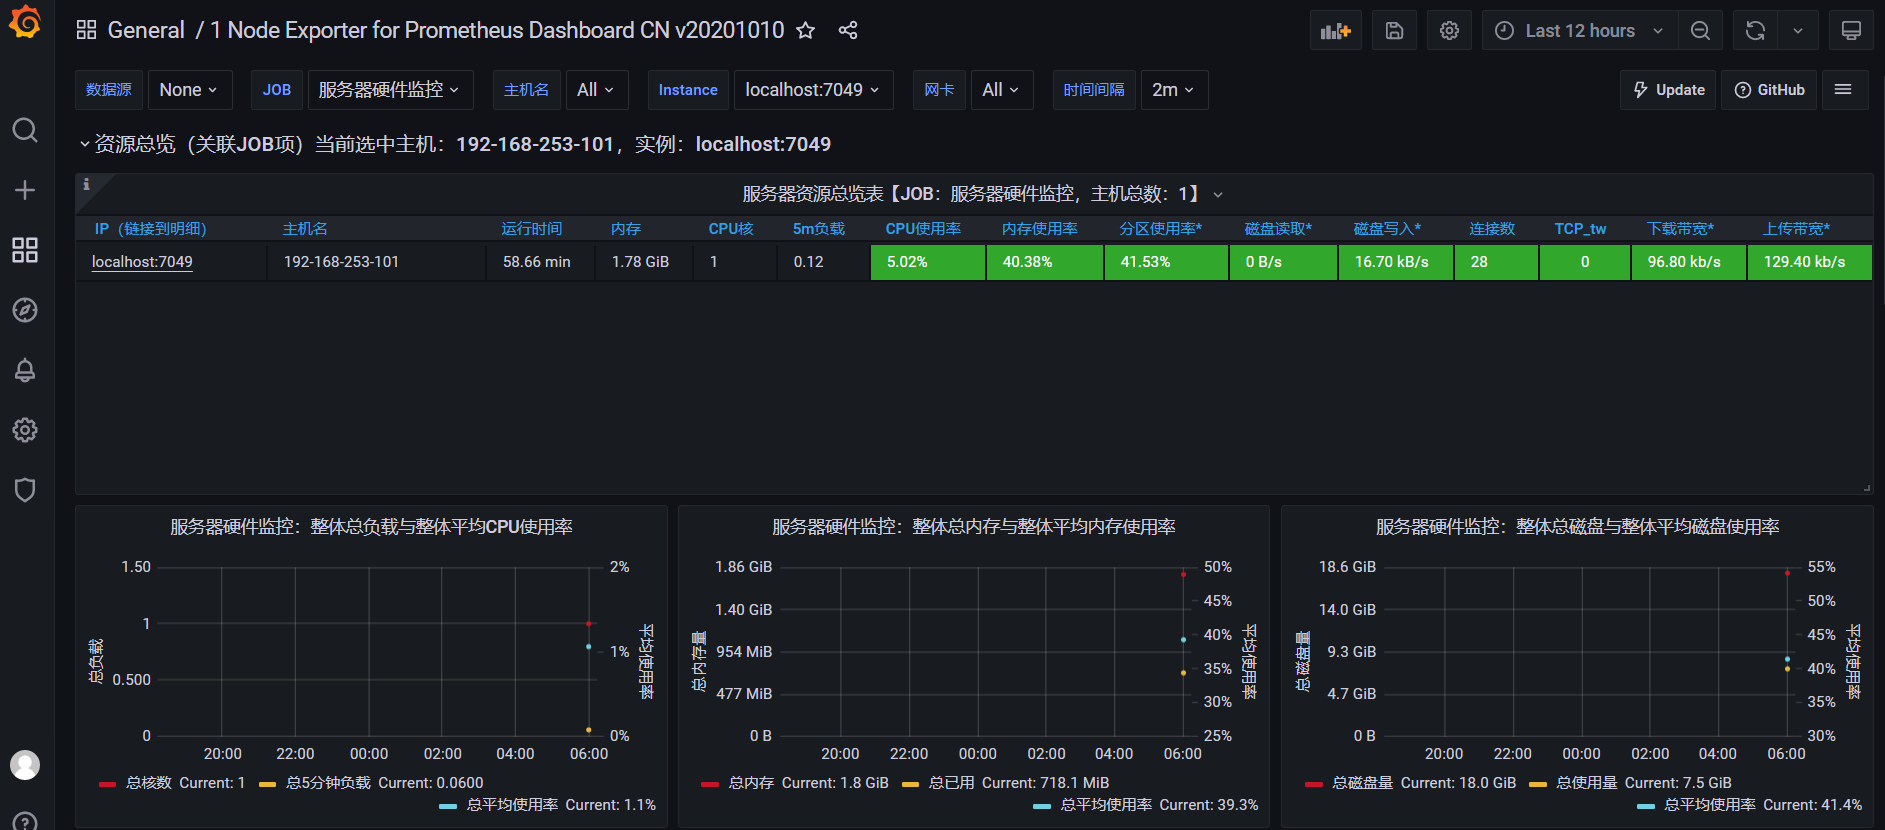
这里的我们使用的是https://grafana.com/grafana/dashboards/8919
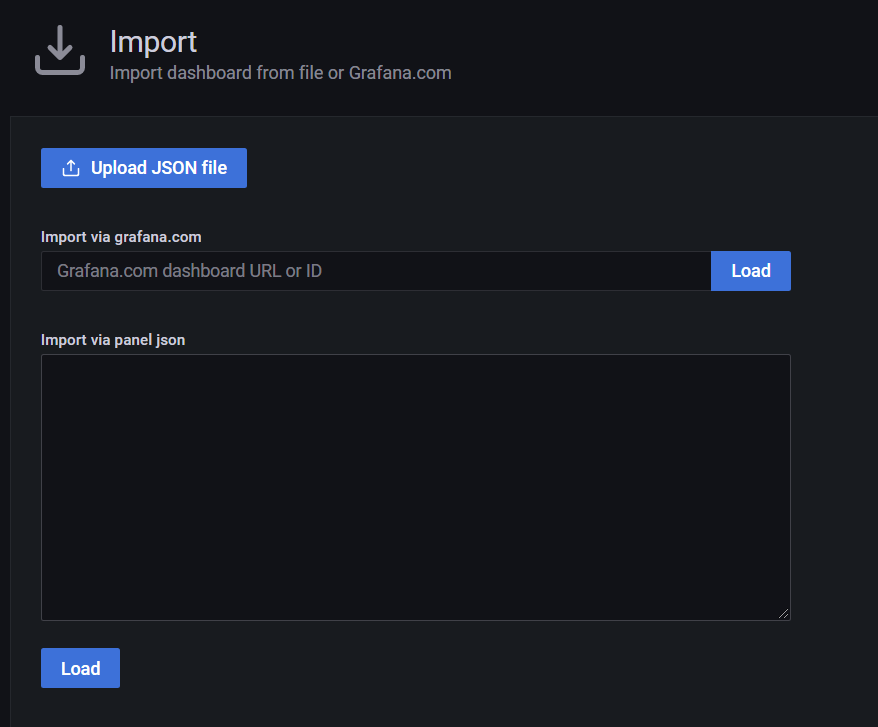
点击[Create]-> [Import]进入到导入dashboard界面,可以直接填入编号或者导入JSON数据的方式来进行导入。导入完成后,可以在[Dashboards]-> [Browse]找到导入的dashboard。

点击该dashboard,可以进入到对应的页面。