
1、下载源码并编译打包
通过Git客户端下载rocketmq-exporter源码
https://github.com/apache/rocketmq-exporter.git
进入到源码目录,然后通过mvn clean install -Dmaven.test.skip=true 命令,进行编译打包。
用360压缩打开target/rocketmq-exporter-0.0.2-SNAPSHOT-exec.jar,找到rocketmq-exporter-0.0.2-SNAPSHOT-exec.jar\BOOT-INF\classes\application.yml,并根据实际情况修改配置信息。
rocketmq:
  config:
    webTelemetryPath: /metrics
    namesrvAddr: 127.0.0.1:9876
    rocketmqVersion: 4_9_4
    enableCollect: true
    enableACL: false # if >=4.4.0
    accessKey:  # if >=4.4.0
    secretKey:  # if >=4.4.0
    outOfTimeSeconds: 60 # Cache clear time with no update
2、启动rocketmq-exporter
上传rocketmq-exporter-0.0.2-SNAPSHOT-exec.jar文件到linux服务器,执行下面命令进行启动。
nohup java -jar rocketmq-exporter-0.0.2-SNAPSHOT-exec.jar &
3、配置Prometheus
在Prometheus配置文件prometheus.yml加入如下内容
- job_name: "rocketmq"
    static_configs:
      - targets: ["localhost:5557"]
然后重启prometheus
ps -ef|grep prometheus
kill -9 xxxx(把上面查询出来的pid填进来)
nohup ./prometheus --config.file=prometheus.yml  > prometheus.log 2>&1 &
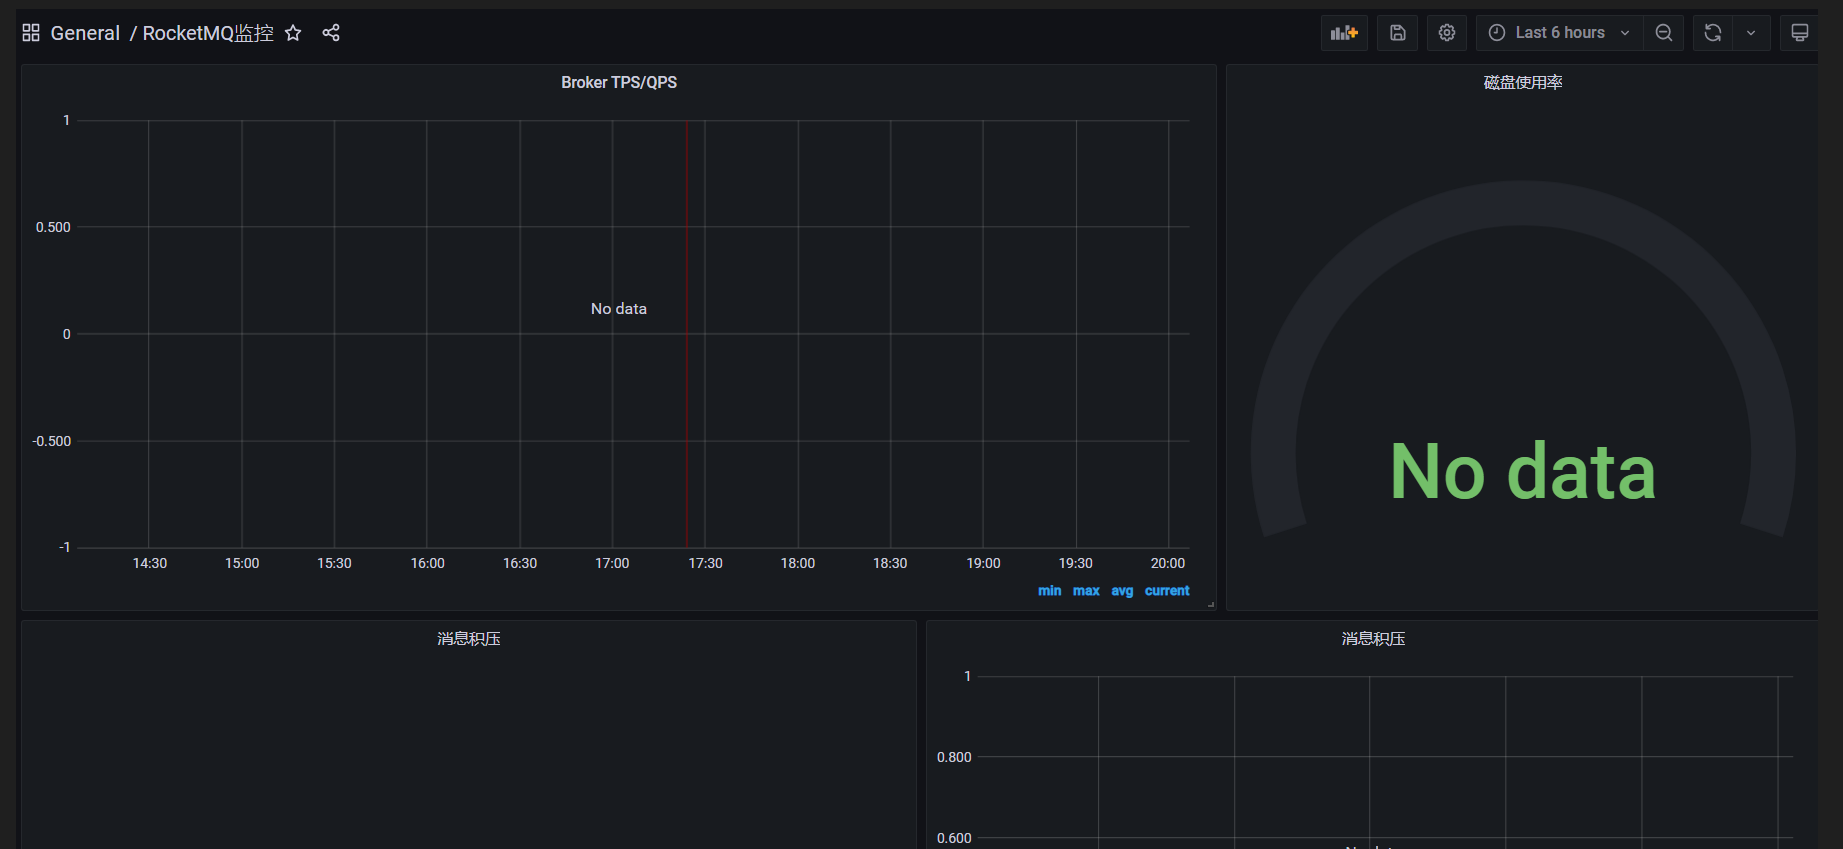
4、grafana配置dashboard
导入https://grafana.com/grafana/dashboards/14612
打完收工!
打赏

