
1、下载安装包
可以从Prometheus官网找到redis exporter下载入口
https://prometheus.io/docs/instrumenting/exporters/
从下面链接找到redis_exporter-v1.45.0.linux-amd64.tar.gz安装包
https://github.com/oliver006/redis_exporter/releases/tag/v1.45.0
2、上传并解压
tar -zxvf redis_exporter-v1.45.0.linux-amd64.tar.gz -C /usr/local/prometheus
3、启动redis_exporter
nohup ./redis_exporter -redis.addr localhost:6379 -redis.password xxx -web.listen-address :9121 > redis_exporter.log 2>&1 &
4、配置Prometheus
在Prometheus配置文件prometheus.yml加入如下内容
- job_name: "redis"
    static_configs:
      - targets: ["localhost:9121"]
然后重启prometheus
ps -ef|grep prometheus
kill -9 xxxx(把上面查询出来的pid填进来)
nohup ./prometheus --config.file=prometheus.yml  > prometheus.log 2>&1 &
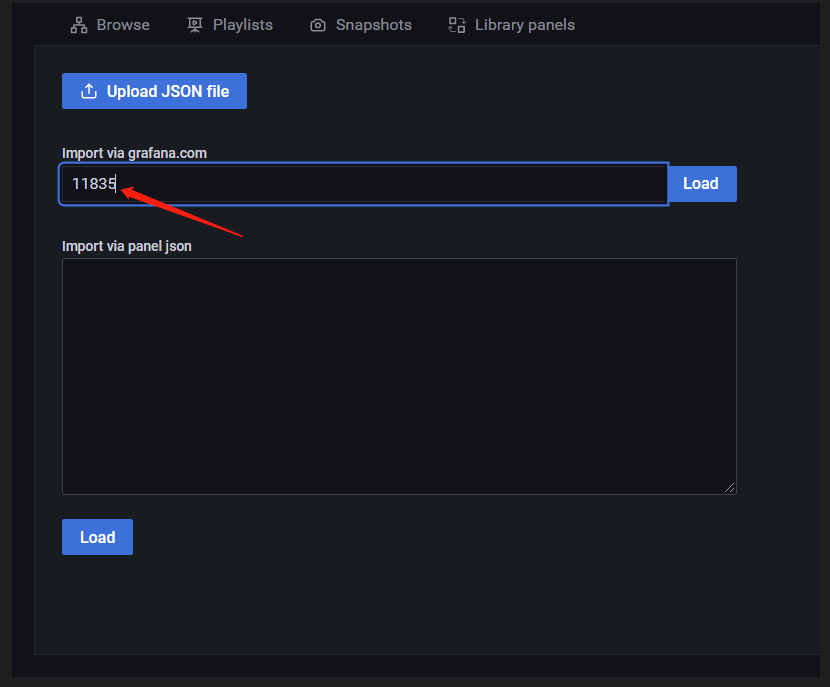
5、grafana配置dashboard
导入https://grafana.com/grafana/dashboards/11835
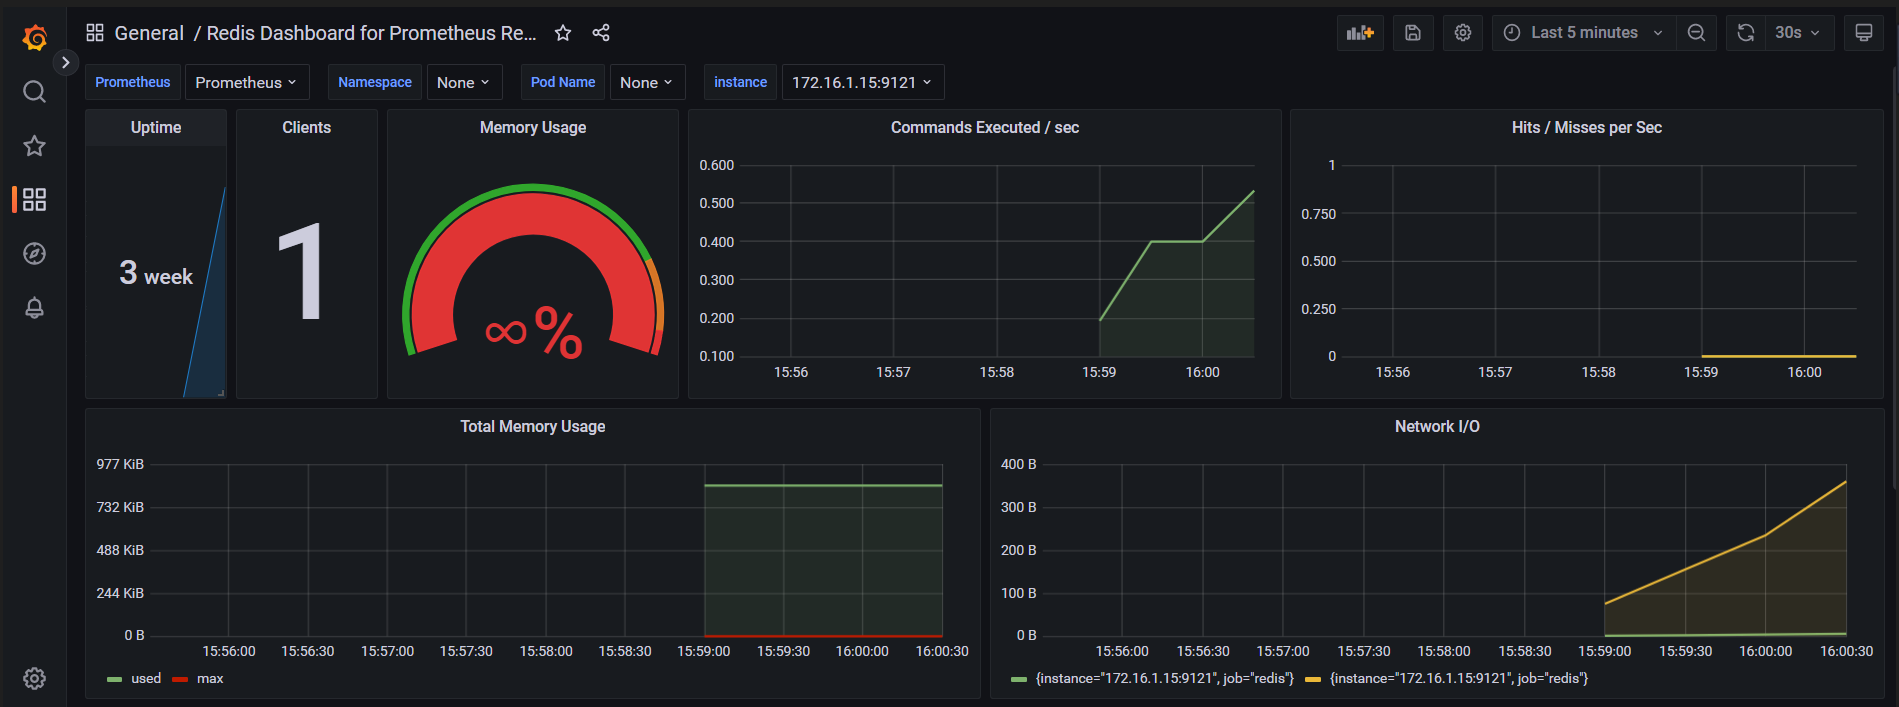
打完收工!
打赏

