
一、当前kubernetes环境
[root@develop ~]# kubelet --version
Kubernetes v1.21.0
kubelet添加配置:
--authentication-token-webhook=true --authorization-mode=Webhook
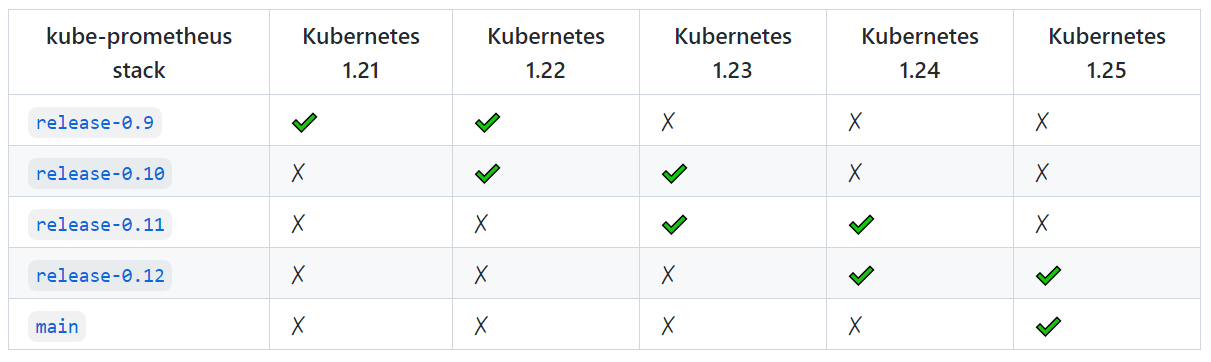
二、下载与kubernetes环境版本匹配的Prometheus
在服务器上执行git命令进行下载:
git clone -b v0.9.0 https://github.com/prometheus-operator/kube-prometheus.git
[root@test-99 prometheus]# git clone -b v0.9.0 https://github.com/prometheus-operator/kube-prometheus.git
Cloning into 'kube-prometheus'...
remote: Enumerating objects: 17591, done.
remote: Counting objects: 100% (140/140), done.
remote: Compressing objects: 100% (64/64), done.
remote: Total 17591 (delta 85), reused 104 (delta 68), pack-reused 17451
Receiving objects: 100% (17591/17591), 9.22 MiB | 1.18 MiB/s, done.
Resolving deltas: 100% (11587/11587), done.
Note: checking out '864ca1e773197d862d67a57d6e9fd83237e29d0b'.
如果服务器没有安装git,也可以直接从github上安装zip包,然后再手动上传。
三、执行安装
1、替换镜像下载地址
进入到kube-prometheus/manifests 目录下
查询包括k8s字眼的镜像:grep image ./* | grep k8s
从https://hub.docker.com/找到对应的替换镜像地址
具体如下:
(1)修改kube-state-metrics-deployment.yaml
k8s.gcr.io/kube-state-metrics/kube-state-metrics:v2.1.1 改为 bitnami/kube-state-metrics:2.1.1
(2)修改prometheus-adapter-deployment.yaml
k8s.gcr.io/prometheus-adapter/prometheus-adapter:v0.9.0 改为 willdockerhub/prometheus-adapter:v0.9.0
2、执行安装
cd kube-prometheus
kubectl apply --server-side -f manifests/setup
kubectl wait \
	--for condition=Established \
	--all CustomResourceDefinition \
	--namespace=monitoring
kubectl apply -f manifests/
3、 查看安装结果
kubectl get pods -n monitoring
[root@test-99 kube-prometheus]# kubectl get pod -n monitoring
NAME                                   READY   STATUS    RESTARTS   AGE
alertmanager-main-0                    2/2     Running   0          13m
alertmanager-main-1                    2/2     Running   0          13m
alertmanager-main-2                    2/2     Running   0          13m
blackbox-exporter-6798fb5bb4-7j2qf     3/3     Running   0          14m
grafana-7476b4c65b-cvpdl               1/1     Running   0          14m
kube-state-metrics-7fcc9c66b-xj4nc     3/3     Running   0          2m15s
node-exporter-d4h4c                    2/2     Running   0          14m
node-exporter-rzwcl                    0/2     Evicted   0          81s
prometheus-adapter-cd877bbf9-bmq5r     1/1     Running   0          14m
prometheus-adapter-cd877bbf9-hsvwh     1/1     Running   0          14m
prometheus-k8s-0                       2/2     Running   0          13m
prometheus-k8s-1                       2/2     Running   0          13m
prometheus-operator-75d9b475d9-nhp6k   2/2     Running   0          15m
等待所有的Pod状态为RUNNING,这个时间可能会耗费十来分钟,主要取决于网络情况。
4、修改Prometheus和Grafana的Service类型为NodePort
(1)查看当前Service
kubectl get service -n monitoring
[root@test-99 kube-prometheus]# kubectl get service -n monitoring
NAME                    TYPE        CLUSTER-IP       EXTERNAL-IP   PORT(S)                      AGE
alertmanager-main       ClusterIP   10.108.123.60    <none>        9093/TCP                     16m
alertmanager-operated   ClusterIP   None             <none>        9093/TCP,9094/TCP,9094/UDP   15m
blackbox-exporter       ClusterIP   10.103.178.188   <none>        9115/TCP,19115/TCP           16m
grafana                 ClusterIP   10.96.88.94      <none>        3000/TCP                     16m
kube-state-metrics      ClusterIP   None             <none>        8443/TCP,9443/TCP            16m
node-exporter           ClusterIP   None             <none>        9100/TCP                     16m
prometheus-adapter      ClusterIP   10.106.220.40    <none>        443/TCP                      16m
prometheus-k8s          ClusterIP   10.103.191.85    <none>        9090/TCP                     16m
prometheus-operated     ClusterIP   None             <none>        9090/TCP                     15m
prometheus-operator     ClusterIP   None             <none>        8443/TCP                     17m
(2)修改Prometheus的Service类型
编辑kube-prometheus/manifests/prometheus-service.yaml,在spec下添加type: NodePort配置,然后重新kubectl apply -f prometheus-service.yaml 使其生效。
apiVersion: v1
kind: Service
metadata:
  labels:
    app.kubernetes.io/component: prometheus
    app.kubernetes.io/name: prometheus
    app.kubernetes.io/part-of: kube-prometheus
    app.kubernetes.io/version: 2.29.1
    prometheus: k8s
  name: prometheus-k8s
  namespace: monitoring
spec:
  type: NodePort
  ports:
  - name: web
    port: 9090
    targetPort: web
  selector:
    app: prometheus
    app.kubernetes.io/component: prometheus
    app.kubernetes.io/name: prometheus
    app.kubernetes.io/part-of: kube-prometheus
    prometheus: k8s
  sessionAffinity: ClientIP
(3)修改Grafana的Service类型
编辑kube-prometheus/manifests/grafana-service.yaml,在spec下添加type: NodePort配置,然后重新kubectl apply -f grafana-service.yaml 使其生效。
(4)查看修改后的效果
[root@test-99 manifests]# kubectl get service -n monitoring
NAME                    TYPE        CLUSTER-IP       EXTERNAL-IP   PORT(S)                      AGE
alertmanager-main       ClusterIP   10.108.123.60    <none>        9093/TCP                     22m
alertmanager-operated   ClusterIP   None             <none>        9093/TCP,9094/TCP,9094/UDP   21m
blackbox-exporter       ClusterIP   10.103.178.188   <none>        9115/TCP,19115/TCP           22m
grafana                 NodePort    10.96.88.94      <none>        3000:31000/TCP               22m
kube-state-metrics      ClusterIP   None             <none>        8443/TCP,9443/TCP            22m
node-exporter           ClusterIP   None             <none>        9100/TCP                     22m
prometheus-adapter      ClusterIP   10.106.220.40    <none>        443/TCP                      22m
prometheus-k8s          NodePort    10.103.191.85    <none>        9090:30894/TCP               22m
prometheus-operated     ClusterIP   None             <none>        9090/TCP                     21m
prometheus-operator     ClusterIP   None             <none>        8443/TCP                     22m
可以看到prometheus-k8s和grafana的TYPE变为NodePort类型。
四、测试
1、在浏览器访问Prometheus
2、 在浏览器访问Grafana
http://172.16.1.17:31000/
默认账号和密码为:admin 、 admin
五、升级Grafana版本
当前安装的kube-prometheus版本为0.9.0,其使用的grafana版本为8.1.1,可以在kube-prometheus/manifests/grafana-deployment.yaml查看,我们在https://grafana.com/grafana/dashboards上查看到的dashboard模板都是要求9.2.3版本的,因此需要对默认的grafana进行版本升级,否则在导入dashboard时候会出现各种各样的错误,比如【Failed to upgrade legacy queries e.replace is not a function】。
升级grafana版本其实很简单,只需要把kube-prometheus/manifests/grafana-deployment.yaml的版本号改为9.2.3即可。
apiVersion: apps/v1
kind: Deployment
metadata:
  labels:
    app.kubernetes.io/component: grafana
    app.kubernetes.io/name: grafana
    app.kubernetes.io/part-of: kube-prometheus
    app.kubernetes.io/version: 9.2.3
  name: grafana
  namespace: monitoring
spec:
  replicas: 1
  selector:
    matchLabels:
      app.kubernetes.io/component: grafana
      app.kubernetes.io/name: grafana
      app.kubernetes.io/part-of: kube-prometheus
  template:
    metadata:
      annotations:
        checksum/grafana-datasources: fbf9c3b28f5667257167c2cec0ac311a
      labels:
        app.kubernetes.io/component: grafana
        app.kubernetes.io/name: grafana
        app.kubernetes.io/part-of: kube-prometheus
        app.kubernetes.io/version: 9.2.3
    spec:
      containers:
      - env: []
        image: grafana/grafana:9.2.3
        name: grafana
修改完成之后,执行kubectl apply -f grafana-deployment.yaml 使其生效。
参考:
https://github.com/prometheus-operator/kube-prometheus
https://www.cnblogs.com/zyyang1993/p/16553959.html

