
一、一段程序代码
public class MinorGCTest {

    public static void main(String[] args) {
        // 1MB
        byte[] array1 = new byte[1024 * 1024];
        array1 = new byte[1024 * 1024];
        array1 = new byte[1024 * 1024];
        array1 = null;

        // 2MB
        byte[] array2 = new byte[2 * 1024 * 1024];
        System.out.println("Well done!");
    }
}
二、代码对应的JVM配置
-XX:+PrintGCDetails -XX:+PrintGCTimeStamps -Xloggc:gc.log -Xms15m -Xmx15m
说明一下:
-XX:+PrintGCDetails 打印详细的GC日志
-XX:+PrintGCTimeStamps 打印GC发生时间
-Xloggc:gc.log 输出GC日志到指定文件gc.log
-Xms15m 配置JVM最小内存大小为15MB
-Xmx15m 配置JVM最大内存大小为15MB
注:运行上面程序代码的JDK为1.8版本,默认的垃圾收集器为Parallel Scavenge(新生代)+Parallel Old(老年代)。
三、运行程序之后输出的GC日志
Java HotSpot(TM) 64-Bit Server VM (25.211-b12) for windows-amd64 JRE (1.8.0_211-b12), built on Apr  1 2019 20:53:26 by "java_re" with MS VC++ 10.0 (VS2010)
Memory: 4k page, physical 8232180k(1829900k free), swap 13737204k(4321720k free)
CommandLine flags: -XX:InitialHeapSize=15728640 -XX:MaxHeapSize=15728640 -XX:+PrintGC -XX:+PrintGCDetails -XX:+PrintGCTimeStamps -XX:+UseCompressedClassPointers -XX:+UseCompressedOops -XX:-UseLargePagesIndividualAllocation -XX:+UseParallelGC
0.166: [GC (Allocation Failure) [PSYoungGen: 3662K->488K(4608K)] 3662K->1752K(15872K), 0.0024022 secs] [Times: user=0.00 sys=0.00, real=0.00 secs]
Heap
 PSYoungGen      total 4608K, used 3721K [0x00000000ffb00000, 0x0000000100000000, 0x0000000100000000)
  eden space 4096K, 78% used [0x00000000ffb00000,0x00000000ffe285d0,0x00000000fff00000)
  from space 512K, 95% used [0x00000000fff00000,0x00000000fff7a020,0x00000000fff80000)
  to   space 512K, 0% used [0x00000000fff80000,0x00000000fff80000,0x0000000100000000)
 ParOldGen       total 11264K, used 1264K [0x00000000ff000000, 0x00000000ffb00000, 0x00000000ffb00000)
  object space 11264K, 11% used [0x00000000ff000000,0x00000000ff13c010,0x00000000ffb00000)
 Metaspace       used 3119K, capacity 4496K, committed 4864K, reserved 1056768K
  class space    used 338K, capacity 388K, committed 512K, reserved 1048576K
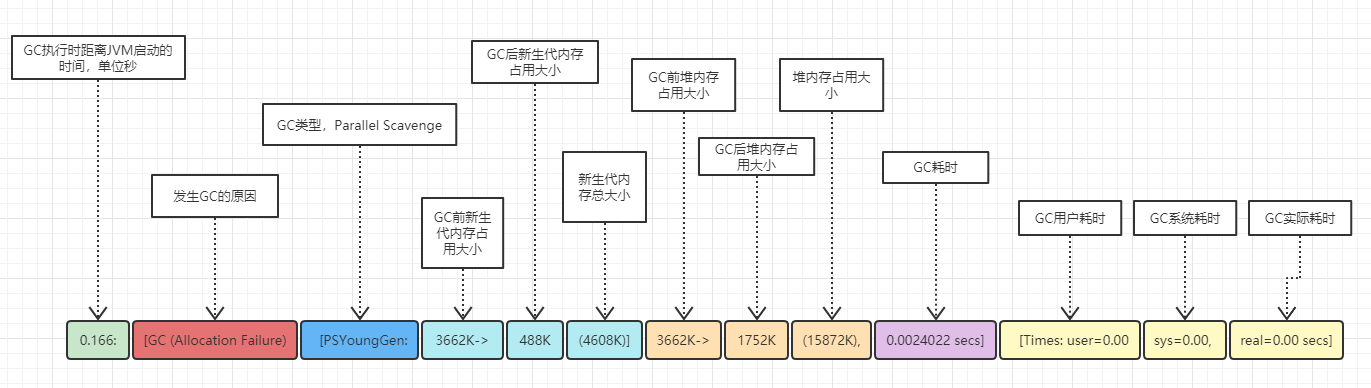
1、Young GC日志
0.166: [GC (Allocation Failure) [PSYoungGen: 3662K->488K(4608K)] 3662K->1752K(15872K), 0.0024022 secs] [Times: user=0.00 sys=0.00, real=0.00 secs]
具体说明如下:
2、GC后堆信息
Heap
 // 新生代总内存大小 4608K,已使用3721K
 PSYoungGen      total 4608K, used 3721K [0x00000000ffb00000, 0x0000000100000000, 0x0000000100000000)
  // Eden区总内存大小 4096K,已使用78%
  eden space 4096K, 78% used [0x00000000ffb00000,0x00000000ffe285d0,0x00000000fff00000)
  // from Survivor区总内存大小512K,已使用95%
  from space 512K, 95% used [0x00000000fff00000,0x00000000fff7a020,0x00000000fff80000)
  // to Survivor区总内存大小512K,已使用0%
  to   space 512K, 0% used [0x00000000fff80000,0x00000000fff80000,0x0000000100000000)
 // 老年代总内存大小 11264K,已使用1264K
 ParOldGen       total 11264K, used 1264K [0x00000000ff000000, 0x00000000ffb00000, 0x00000000ffb00000)
  object space 11264K, 11% used [0x00000000ff000000,0x00000000ff13c010,0x00000000ffb00000)
 Metaspace       used 3119K, capacity 4496K, committed 4864K, reserved 1056768K
  class space    used 338K, capacity 388K, committed 512K, reserved 1048576K
3、Metaspace
在GC日志中,可以看到下面关于Metaspace的信息。
Metaspace used 3119K, capacity 4496K, committed 4864K, reserved 1056768K
class space used 338K, capacity 388K, committed 512K, reserved 1048576K
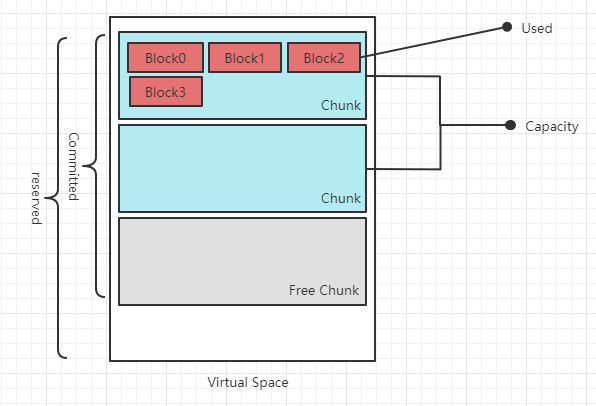
reserved:操作系统给JVM预留的连续内存空间大小。
committed:JVM实际使用的连续内存空间大小,也就是操作系统真正给JVM分配的内存大小。
capacity和used类似于ArrayList中的capacity和size,capacity为预分配容量,used为实际使用的容量大小。

