
Arthas的相关介绍和使用说明请查看下面官方文档,非常详细了,这里只是记录下个人最常用的功能
https://arthas.aliyun.com/doc/
一、生产环境怎么安装Arthas?
通过下面的命令下载arthas并启动,启动之后会输出当前所有的java进程,选择某一个进程序号进行监控。
curl -O https://arthas.aliyun.com/arthas-boot.jar
java -jar arthas-boot.jar
二、如何通过Arthas查看生产环境某个方法的入参和出参?
可以通过命令查看入参和返回值
watch demo.MathGame primeFactors -b -n 2 -x 2
说明一下:
demo.MathGame: 类全名
primeFactors:要监控的方法
-b:表示方法执行之前
-n 2:表示执行两次,默认情况下不限次数
-x 2:表示输出结果的属性遍历深度,默认为 1,最大值是 4
在输出结果中,可以看到result是一个ArrayList数组,包含了入参、this对象以及返回值,对应的观察表达式为{params, target, returnObj},如果只需要查看入参,则命令可以这样写:
watch demo.MathGame primeFactors “{params}” -b -n 2 -x 2
具体执行效果如下:
[arthas@29852]$ watch demo.MathGame primeFactors  -b -n 2 -x 2
Press Q or Ctrl+C to abort.
Affect(class count: 1 , method count: 1) cost in 30 ms, listenerId: 3
method=demo.MathGame.primeFactors location=AtEnter
ts=2023-10-09 10:07:00; [cost=0.039916ms] result=@ArrayList[
    @Object[][
        @Integer[88483],
    ],
    @MathGame[
        random=@Random[java.util.Random@6576fe71],
        illegalArgumentCount=@Integer[1230],
    ],
    null,
]
method=demo.MathGame.primeFactors location=AtEnter
ts=2023-10-09 10:07:01; [cost=0.00919ms] result=@ArrayList[
    @Object[][
        @Integer[-102550],
    ],
    @MathGame[
        random=@Random[java.util.Random@6576fe71],
        illegalArgumentCount=@Integer[1230],
    ],
    null,
]
Command execution times exceed limit: 2, so command will exit. You can set it with -n option.

[arthas@29852]$ watch demo.MathGame primeFactors "{params}" -b -n 2 -x 2
Press Q or Ctrl+C to abort.
Affect(class count: 1 , method count: 1) cost in 31 ms, listenerId: 2
method=demo.MathGame.primeFactors location=AtEnter
ts=2023-10-09 10:06:26; [cost=0.061243ms] result=@ArrayList[
    @Object[][
        @Integer[-82840],
    ],
]
method=demo.MathGame.primeFactors location=AtEnter
ts=2023-10-09 10:06:27; [cost=0.011272ms] result=@ArrayList[
    @Object[][
        @Integer[-114333],
    ],
]
Command execution times exceed limit: 2, so command will exit. You can set it with -n option.
三、如果通过Arthas查看生产环境某个方法的执行耗时?
同样适用watch命令,在输出结果中cost属性就是方法的执行耗时
watch demo.MathGame primeFactors -n 2 -x 2
具体执行效果如下:
[arthas@29852]$ watch demo.MathGame primeFactors  -n 2 -x 2
Press Q or Ctrl+C to abort.
Affect(class count: 1 , method count: 1) cost in 31 ms, listenerId: 5
method=demo.MathGame.primeFactors location=AtExceptionExit
ts=2023-10-09 10:14:48; [cost=0.167398ms] result=@ArrayList[
    @Object[][
        @Integer[-6808],
    ],
    @MathGame[
        random=@Random[java.util.Random@6576fe71],
        illegalArgumentCount=@Integer[1465],
    ],
    null,
]
method=demo.MathGame.primeFactors location=AtExit
ts=2023-10-09 10:14:49; [cost=0.14319ms] result=@ArrayList[
    @Object[][
        @Integer[1],
    ],
    @MathGame[
        random=@Random[java.util.Random@6576fe71],
        illegalArgumentCount=@Integer[1465],
    ],
    @ArrayList[
        @Integer[2],
        @Integer[5],
        @Integer[53],
        @Integer[397],
    ],
]
Command execution times exceed limit: 2, so command will exit. You can set it with -n option.
四、方法内部有多个方法调用,包括内部和外部的,怎么监控每个内部方法的执行耗时?
有时候我们的方法调用了外部的服务接口,当反馈方法耗时较长时,不确定是内部耗时大还是调用外部服务接口耗时大,这个时候就需要监控每个内部方法的具体耗时了,可以使用下面命令:
trace demo.MathGame run -n 2
具体执行效果如下:
[arthas@6383]$ trace demo.MathGame run -n 2
Press Q or Ctrl+C to abort.
Affect(class count: 1 , method count: 1) cost in 123 ms, listenerId: 1
`---ts=2023-10-09 10:45:03;thread_name=main;id=1;is_daemon=false;priority=5;TCCL=sun.misc.Launcher$AppClassLoader@70dea4e
    `---[0.577397ms] demo.MathGame:run()
        +---[7.76% 0.044813ms ] demo.MathGame:primeFactors() #24
        `---[30.18% 0.174254ms ] demo.MathGame:print() #25

`---ts=2023-10-09 10:45:04;thread_name=main;id=1;is_daemon=false;priority=5;TCCL=sun.misc.Launcher$AppClassLoader@70dea4e
    `---[0.742973ms] demo.MathGame:run()
        +---[80.64% 0.599147ms ] demo.MathGame:primeFactors() #24
        `---[12.13% 0.090094ms ] demo.MathGame:print() #25

Command execution times exceed limit: 2, so command will exit. You can set it with -n option.
五、java应用消耗CPU严重,怎么定位出来是哪个线程造成的?
有时候我们生产环境的java应用,会发现特别吃CPU,可以通过top命令查看,如下图所示
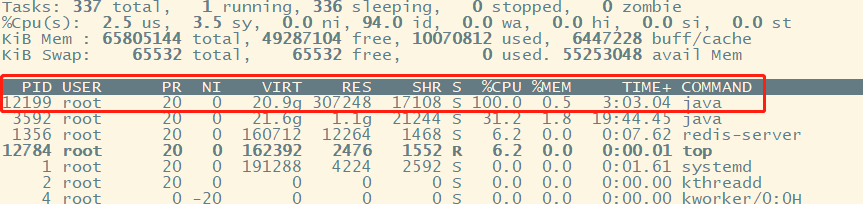
那么我们怎么快速定位应用内部是哪个线程的问题呢?
可以结合Arthas的dashboard和thread命令,具体操作如下:
① 输入dashboard查看线程执行情况
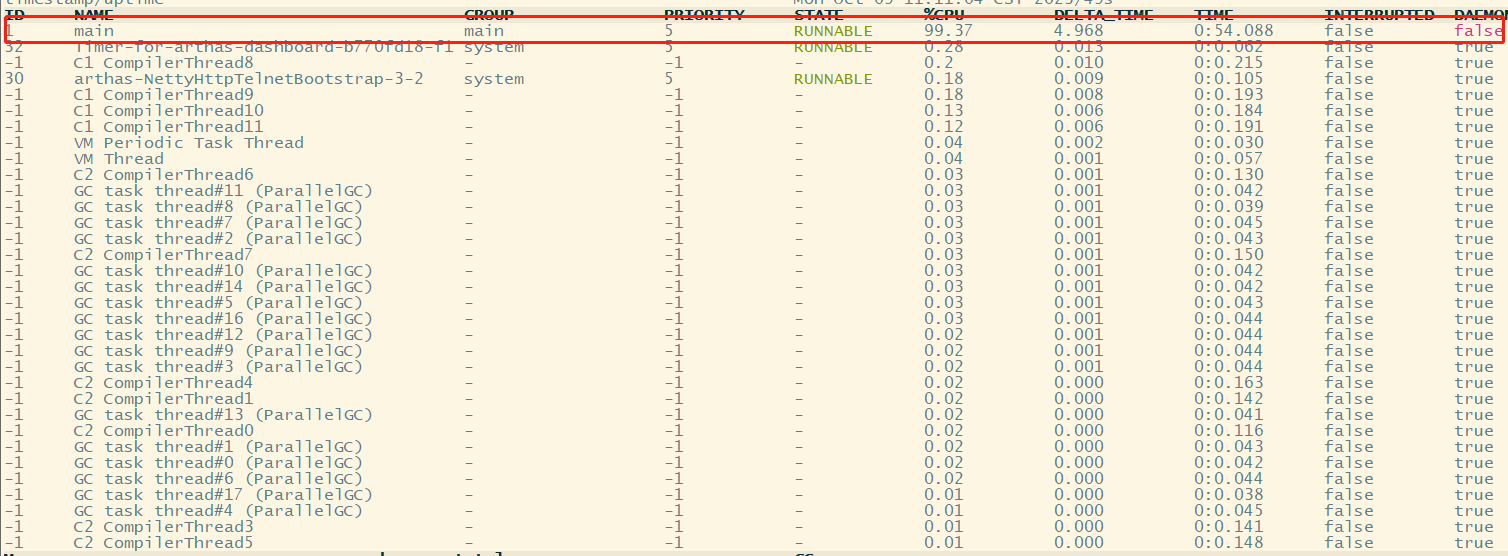
从上图所示,找出吃CPU的线程号为1。
② 输入thread [线程号] 查看线程内部执行堆栈
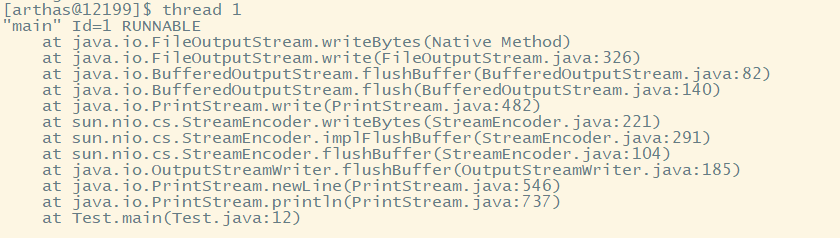
如上图所示,发现是Test类的main方法。

